
Air is not just a number on an app. It is geography, heat, wind, smoke, industry, and season. The Professional Air Quality Atlas compares 800 places through a practical environmental-risk lens so readers can understand why some places breathe easier and others trap harm.
Most air quality conversations begin with a number.
AQI.
PM2.5.
Ozone.
Those numbers matter. But numbers alone can hide the shape of a place.
Air is not only chemistry. It is terrain. It is wind. It is heat. It is smoke. It is winter behavior. It is whether a valley breathes, whether a coastline flushes, whether a city sits under an invisible lid.
That is what the Professional Air Quality Atlas tries to make visible.
The atlas is an 800-location environmental-risk matrix. It does not pretend that every block in every city has been personally measured. That would be false precision. Instead, it compares places through a consistent screening lens: wildfire smoke, inversion physics, residential wood smoke, ozone, basin trapping, and dust or industrial exposure.
In other words, it asks a more useful question than "Is this place clean today?"
It asks:
What kind of air problem is this place structurally built to have?
Why This Matters
Modern life trains people to think of air quality as a daily inconvenience. A bad day. A smoky week. A summer alert.
But air has memory.
A valley that traps cold air in winter will do it again. A region that cooks ozone under heat and traffic will do it again. A town surrounded by woodstove culture will smell different in January than it does in June. A beautiful mountain community can become a smoke corridor. A coastal town can breathe well most of the year and still receive wildfire smoke during major regional events.
This is why relocation decisions, health-sensitive housing decisions, and environmental planning cannot rely on one screenshot from one app.
They need pattern recognition.
The atlas is a pattern-recognition tool.
The Six Conditions That Shape the Matrix
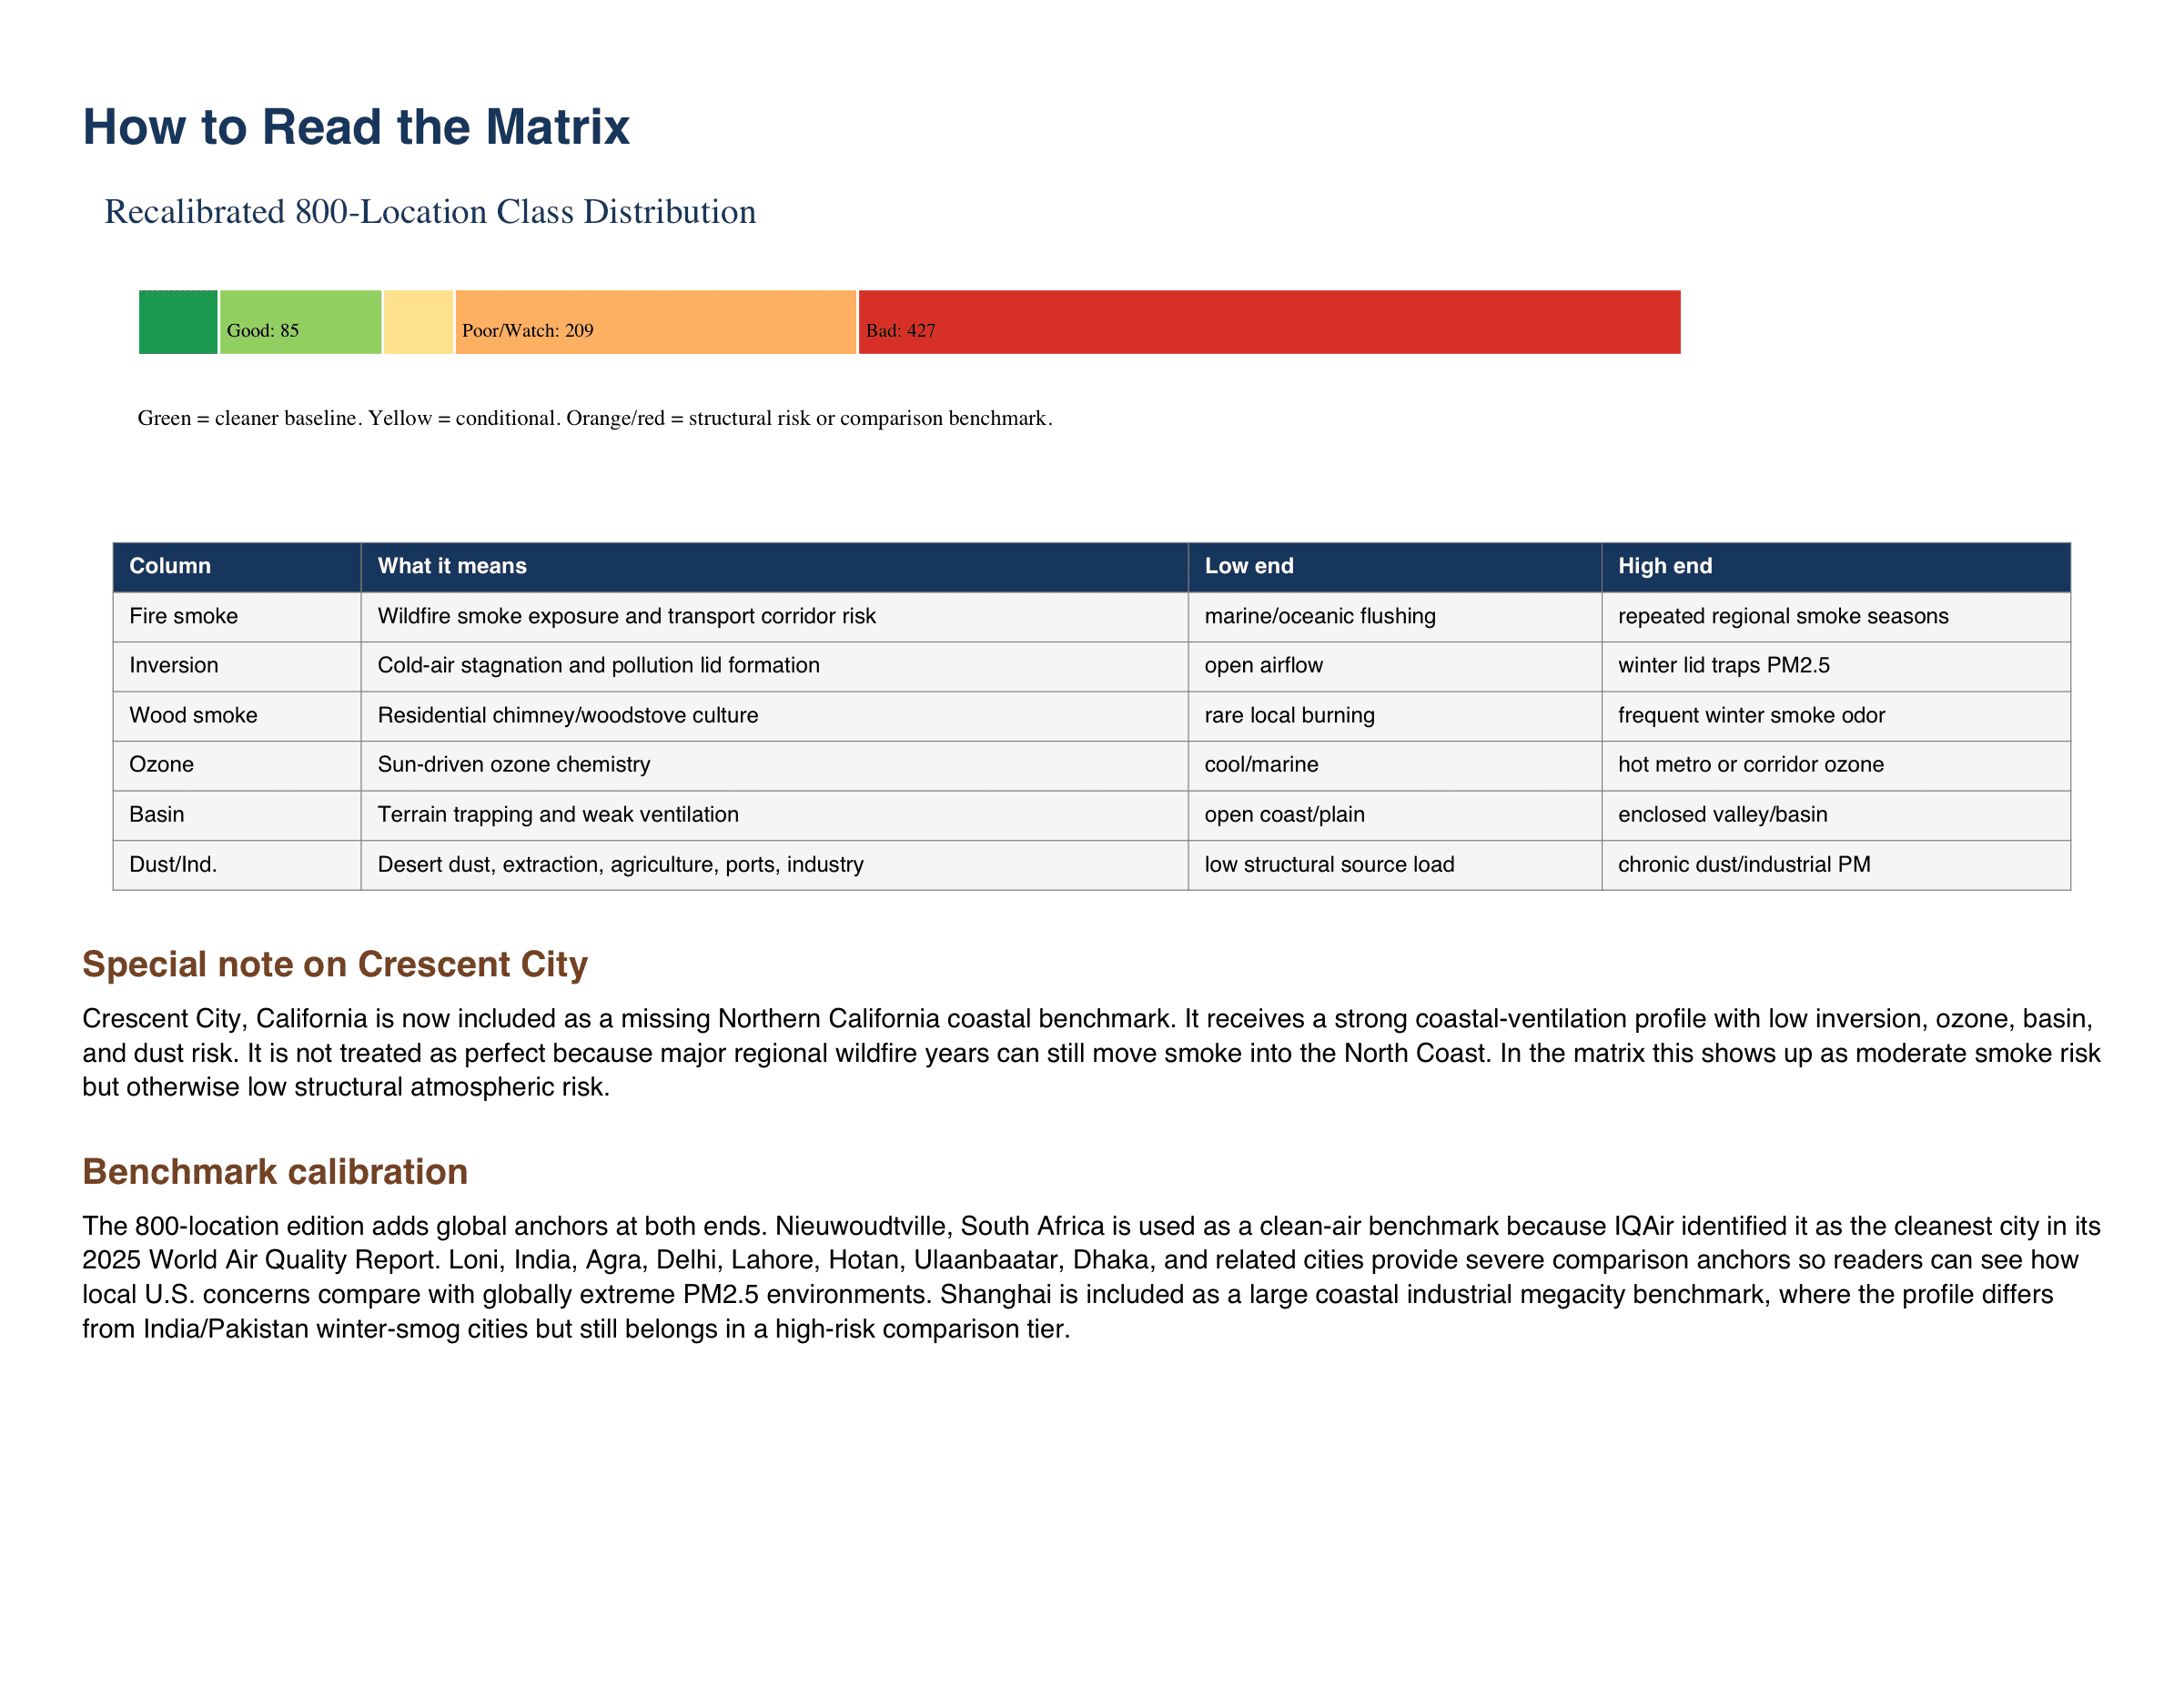
The atlas does not rank air with one number. It reads the forces that make a place breathe well or trap pollution.
The matrix compares each location across six practical risk categories.
Fire smoke measures wildfire smoke exposure and transport-corridor risk. Some places benefit from marine air and frequent flushing. Others sit in repeated regional smoke pathways.
Inversion measures cold-air stagnation and pollution-lid formation. Open airflow lowers risk. Winter inversion basins can trap PM2.5 close to the ground.
Wood smoke measures residential chimney and woodstove culture. In some places, local burning is rare. In others, winter air carries a regular smoke odor from heating practices.
Ozone measures sun-driven ozone chemistry. Cool marine climates tend to reduce ozone formation. Hot metro corridors and inland heat basins tend to increase it.
Basin risk measures terrain trapping and weak ventilation. Open coastlines and plains usually breathe better than enclosed valleys and basins.
Dust and industrial exposure measures structural source load from desert dust, extraction, agriculture, ports, and industrial activity.
None of these categories tells the whole story by itself.
Together, they reveal the shape of the air.
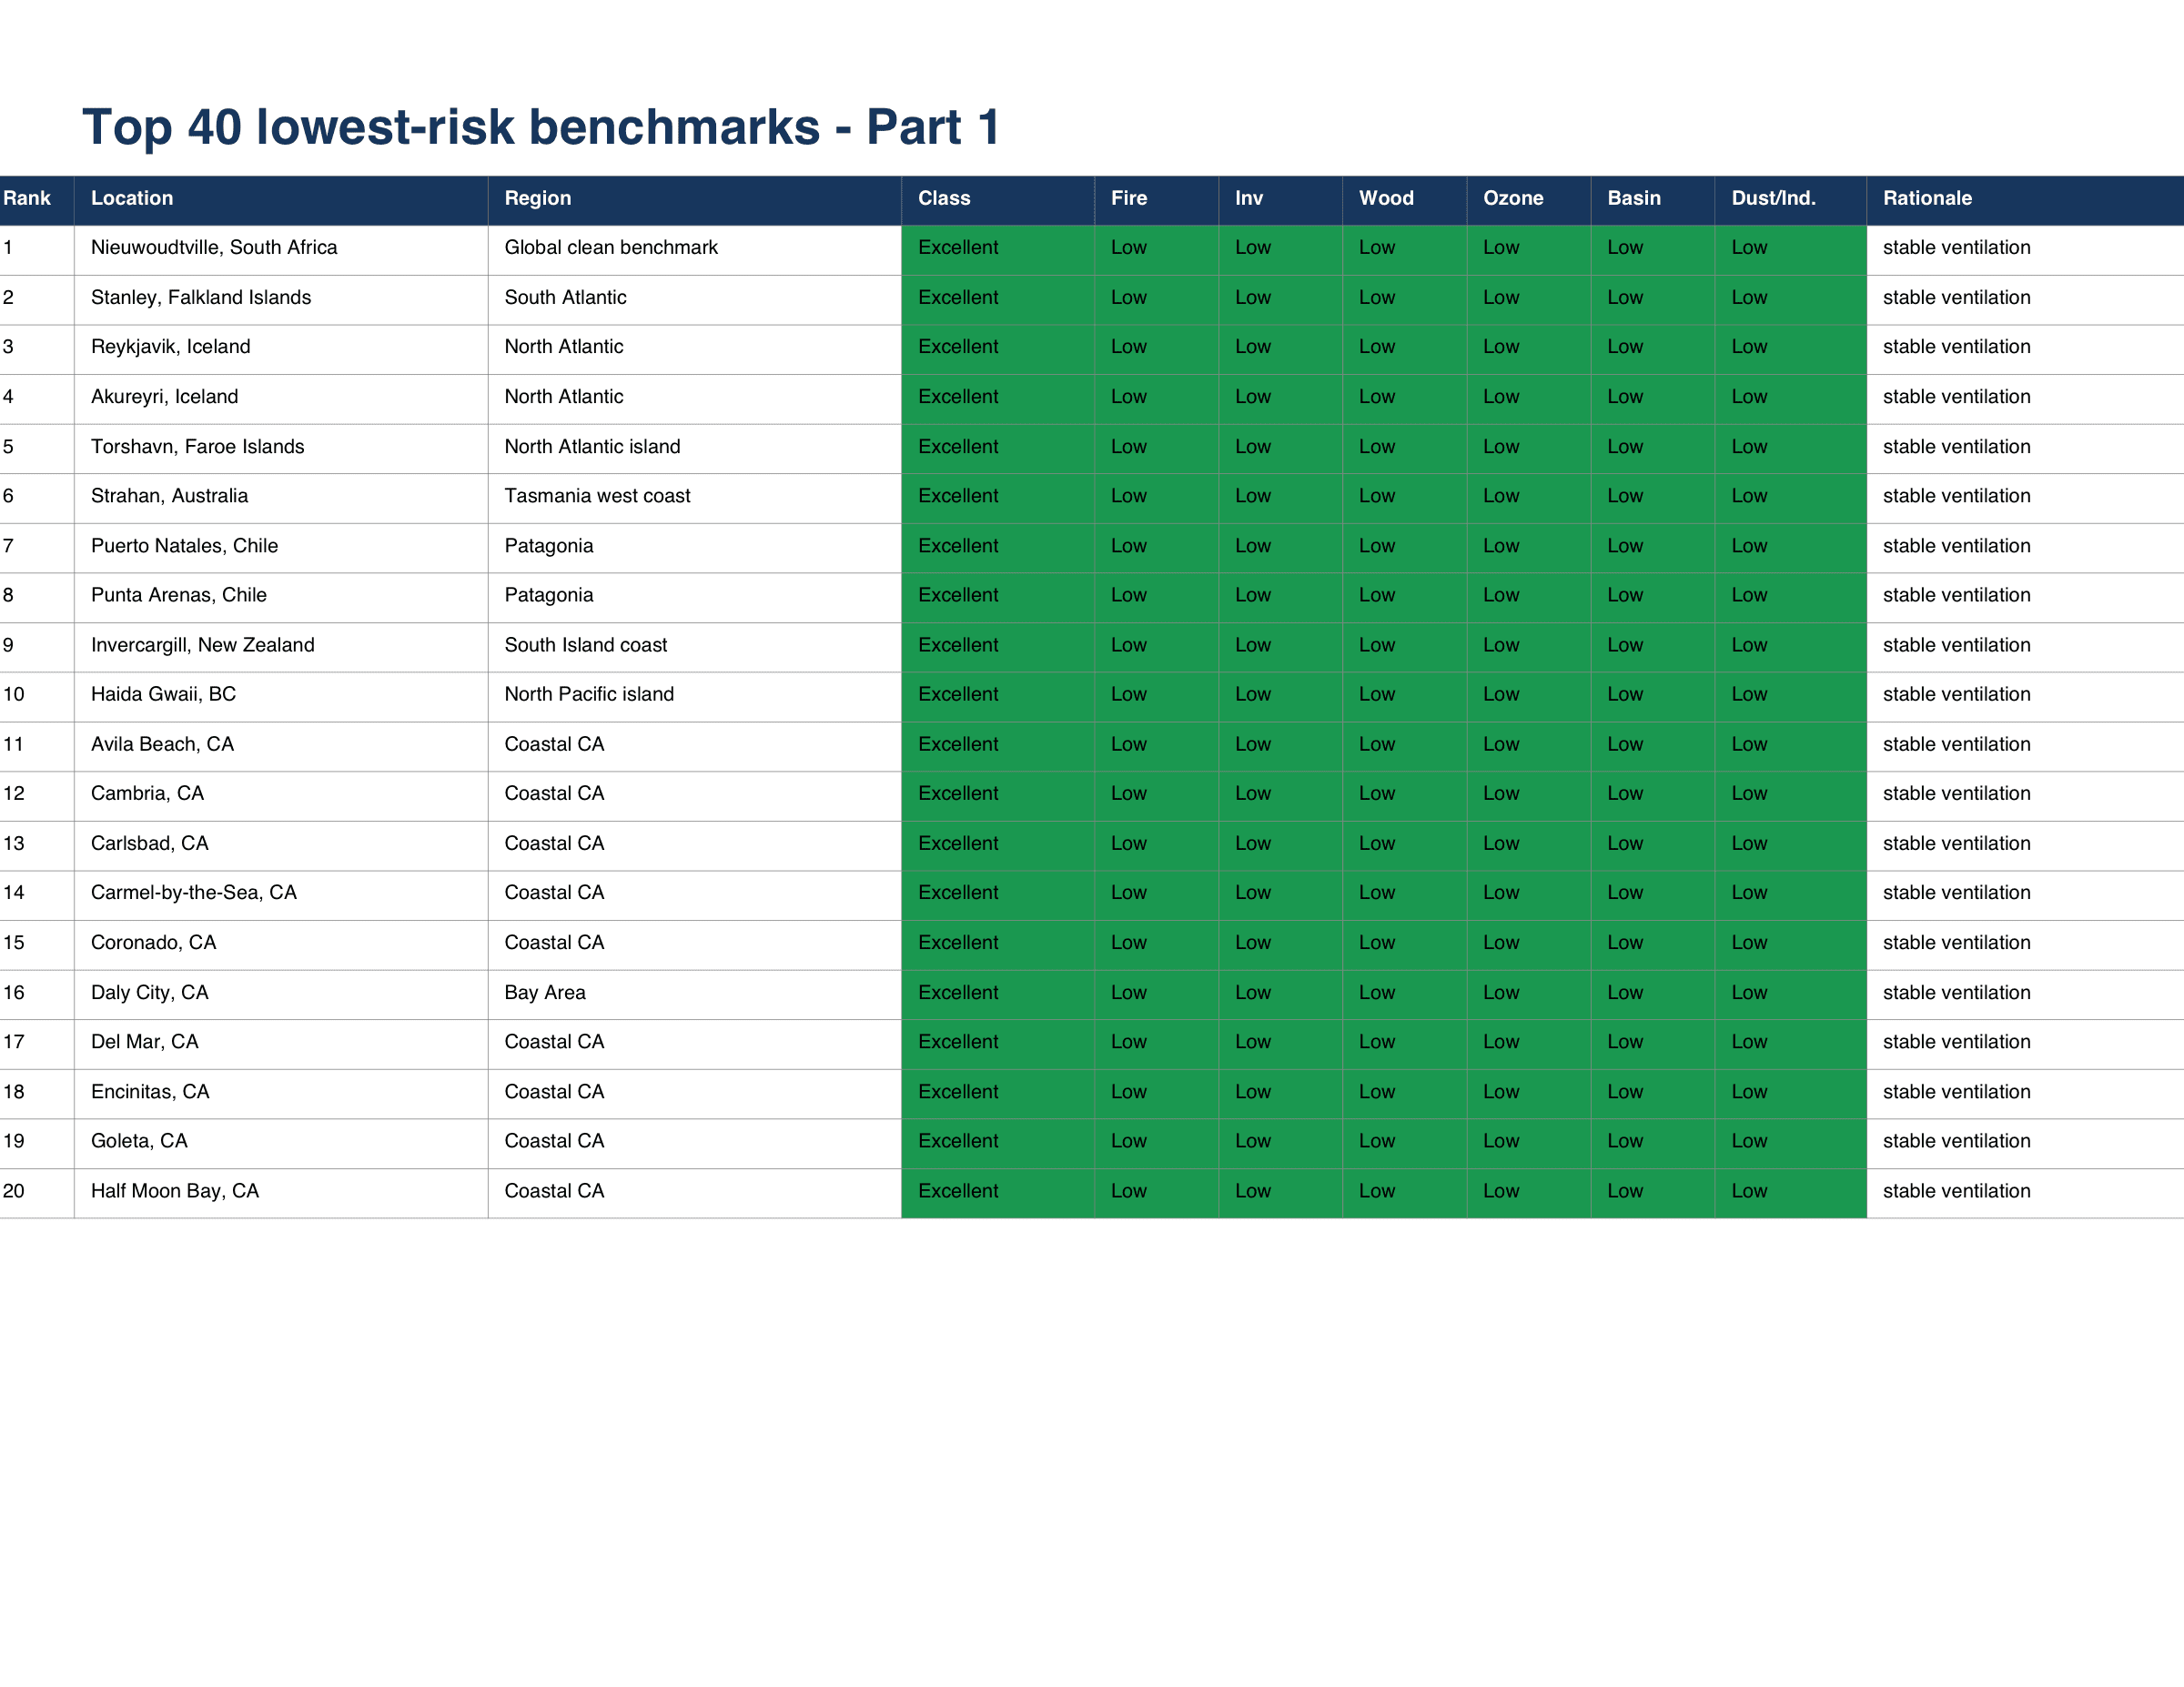
The Clean-Air Pattern: Ventilation Wins
The lowest-risk places are not mystical. They are usually places where air moves.
The lowest-risk benchmarks in the atlas share a simple trait:
They breathe.
The leading clean-air benchmarks include Nieuwoudtville in South Africa, Stanley in the Falkland Islands, Reykjavik and Akureyri in Iceland, Torshavn in the Faroe Islands, Strahan in Tasmania, Puerto Natales and Punta Arenas in Chile, Invercargill in New Zealand, and Haida Gwaii in British Columbia.
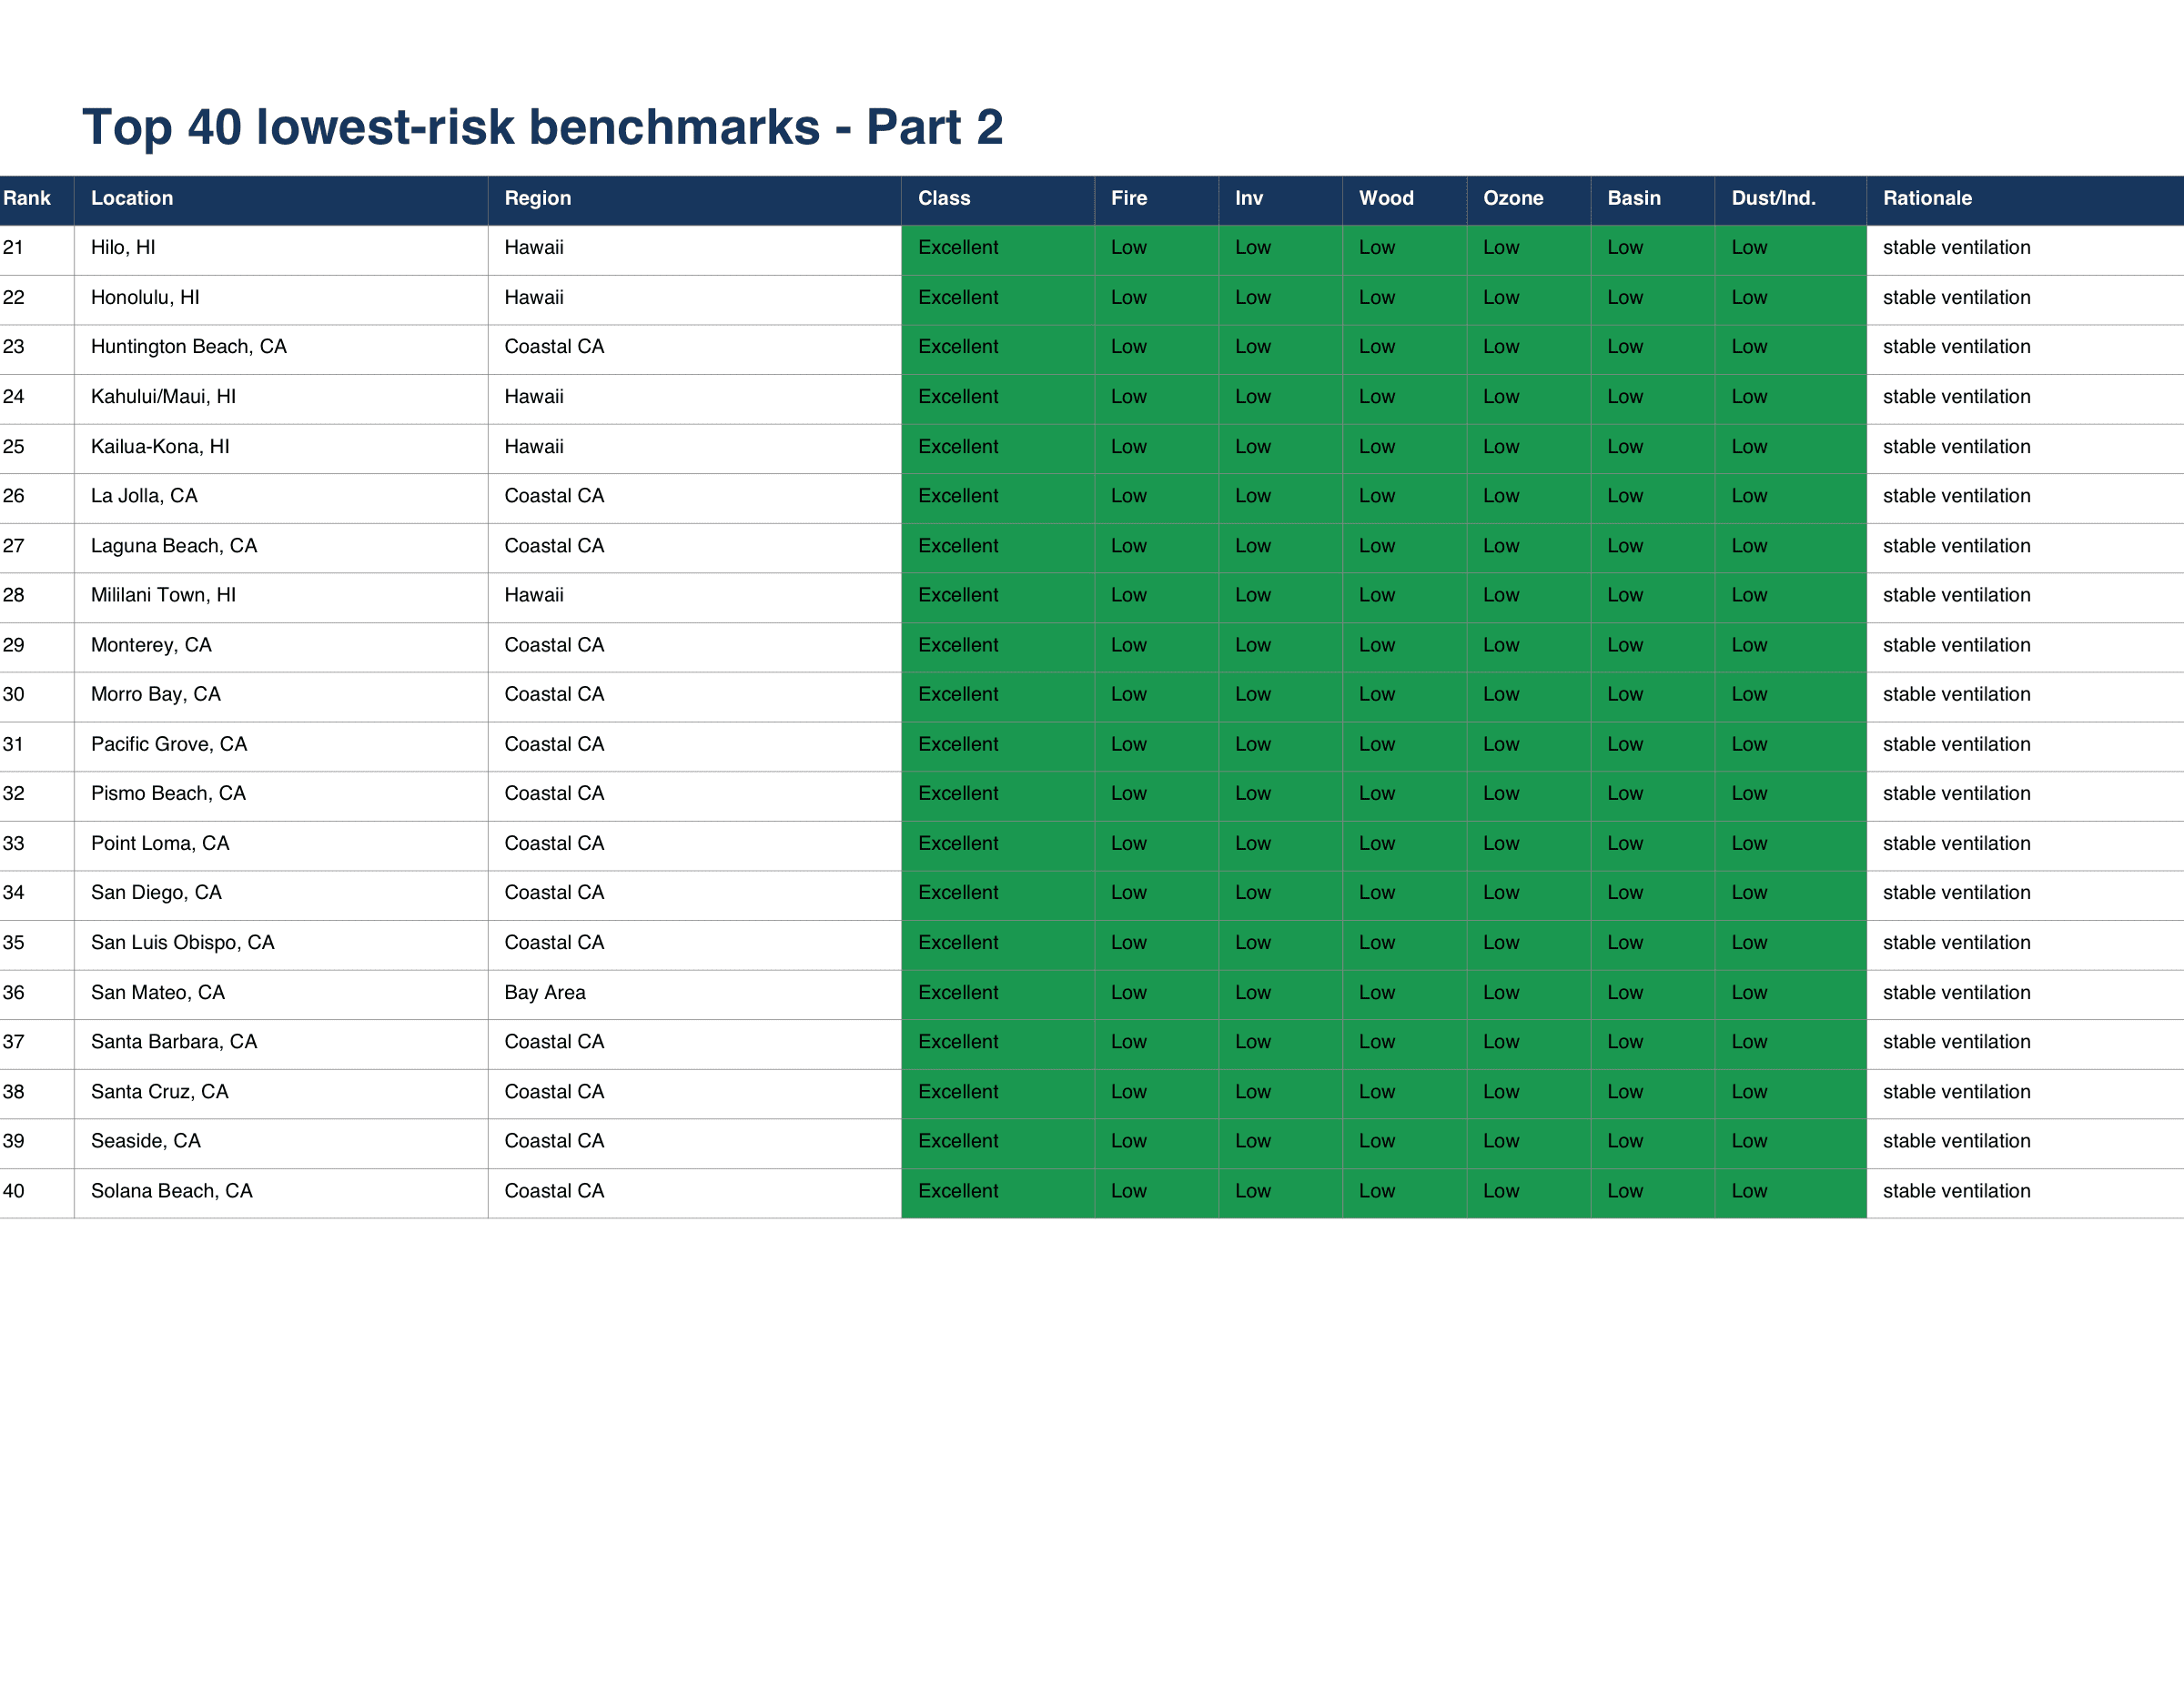
Many of the lowest-risk U.S. benchmarks also follow the same logic: coastal California, Hawaii, and ocean-exposed communities with cool air, steady ventilation, and lower structural trapping risk.
Places like Avila Beach, Cambria, Carmel-by-the-Sea, Coronado, Del Mar, Encinitas, Goleta, Half Moon Bay, Hilo, Honolulu, La Jolla, Laguna Beach, Monterey, Morro Bay, Pacific Grove, San Diego, San Luis Obispo, Santa Barbara, Santa Cruz, and Solana Beach appear in the atlas because their baseline physics are favorable.
They are not perfect.
No place is.
But the pattern is clear: marine flushing, cool air, open ventilation, and low local combustion sources reduce structural risk.
That is the quiet lesson of the green tier.
Clean air is not magic.
It is movement.
The Watch Zone: Places That Look Fine Until the Season Changes
The middle of the matrix is where people need to slow down, check the season, and look locally.
The middle of the atlas is where the story becomes more complicated.
These are the places that may look healthy on a spring afternoon but change character during smoke season, winter inversion, heat waves, or burn-heavy months.
The atlas classifies these locations as conditional. They are not necessarily places to avoid. They are places to investigate.
This is an important distinction.
A "Poor/Watch" profile does not mean a town is unlivable. It means the air may depend heavily on season, neighborhood, terrain, local burning rules, and regional smoke transport.
That is where people often make mistakes.
They visit in the wrong month.
They check the wrong sensor.
They compare average weather instead of worst-case air.
They fall in love with a view and forget that the view may sit inside a bowl.
The atlas is useful because it slows that decision down.
It says: look again.
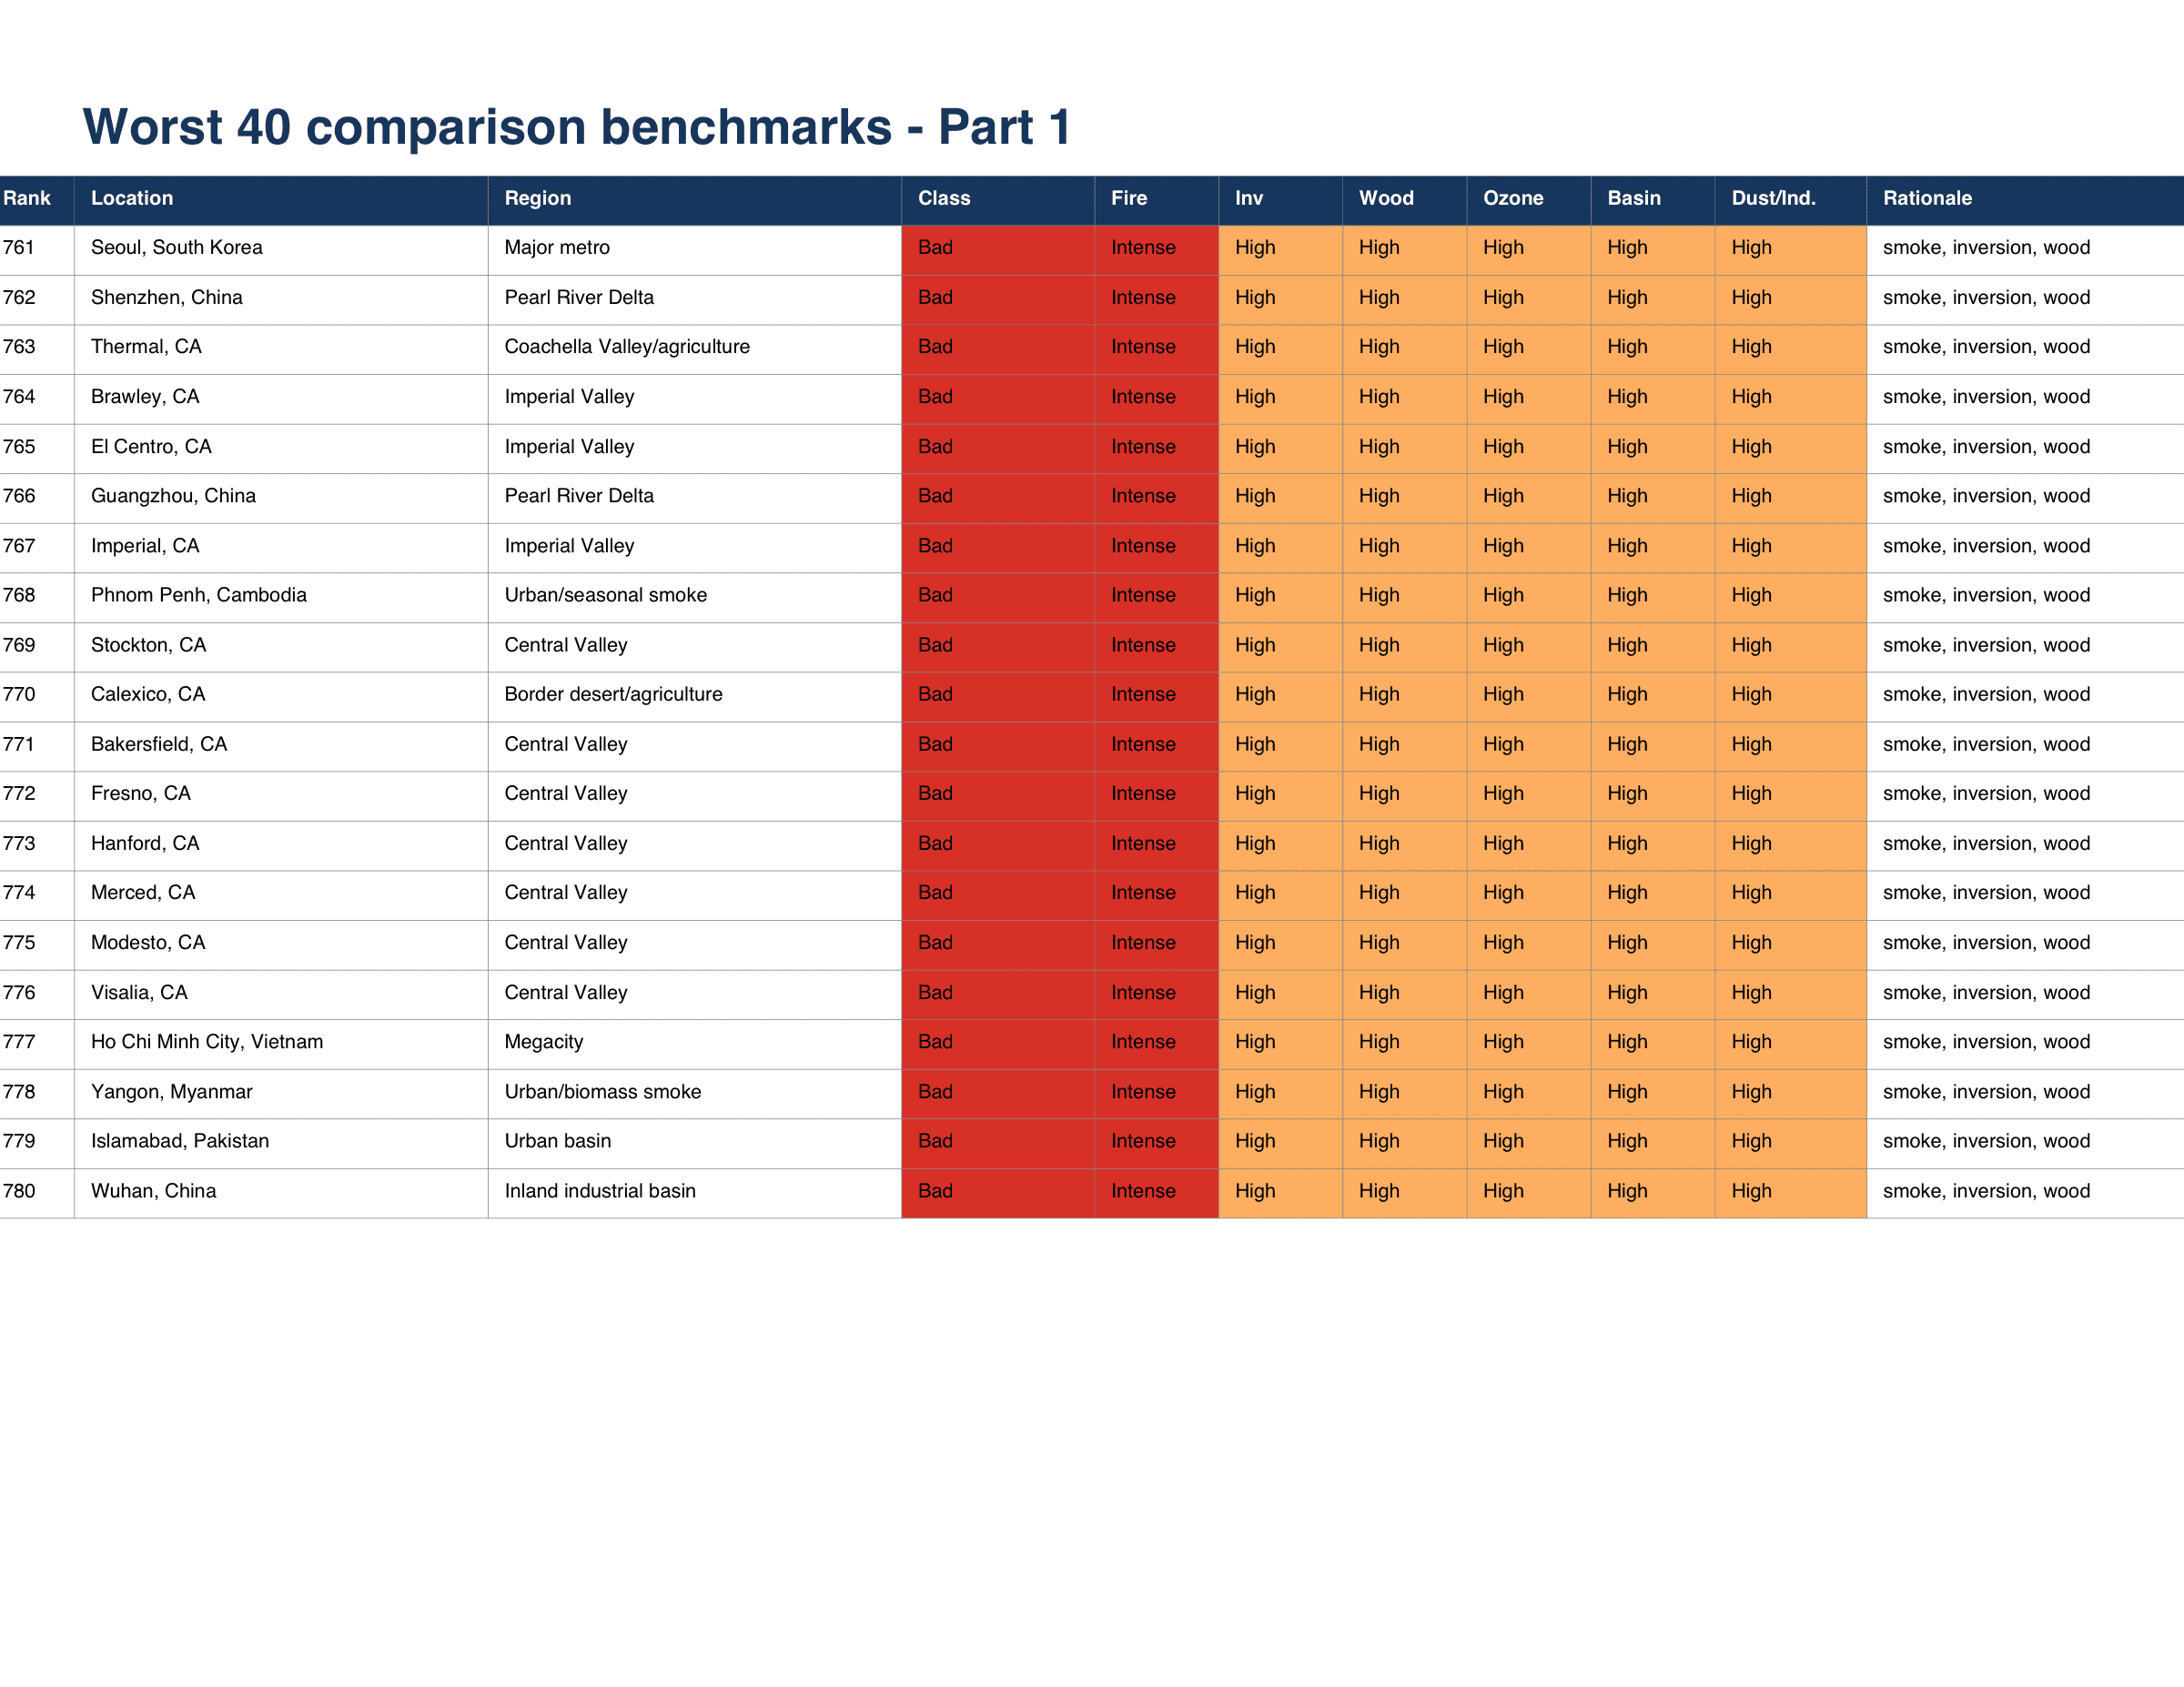
The Red Zone: When Beauty and Breathability Split Apart
Some places are visually beautiful and atmospherically burdened. The matrix helps separate scenery from exposure.
Some places are visually stunning and atmospherically punishing.
That is one of the harder truths in environmental health.
Mountain towns can trap smoke. Desert towns can carry dust. Agricultural valleys can combine PM, ozone, and inversion. Industrial corridors can add chronic exposure even when the skyline looks calm. Global megacities can carry layered burdens of traffic, combustion, dust, industry, and seasonal stagnation.
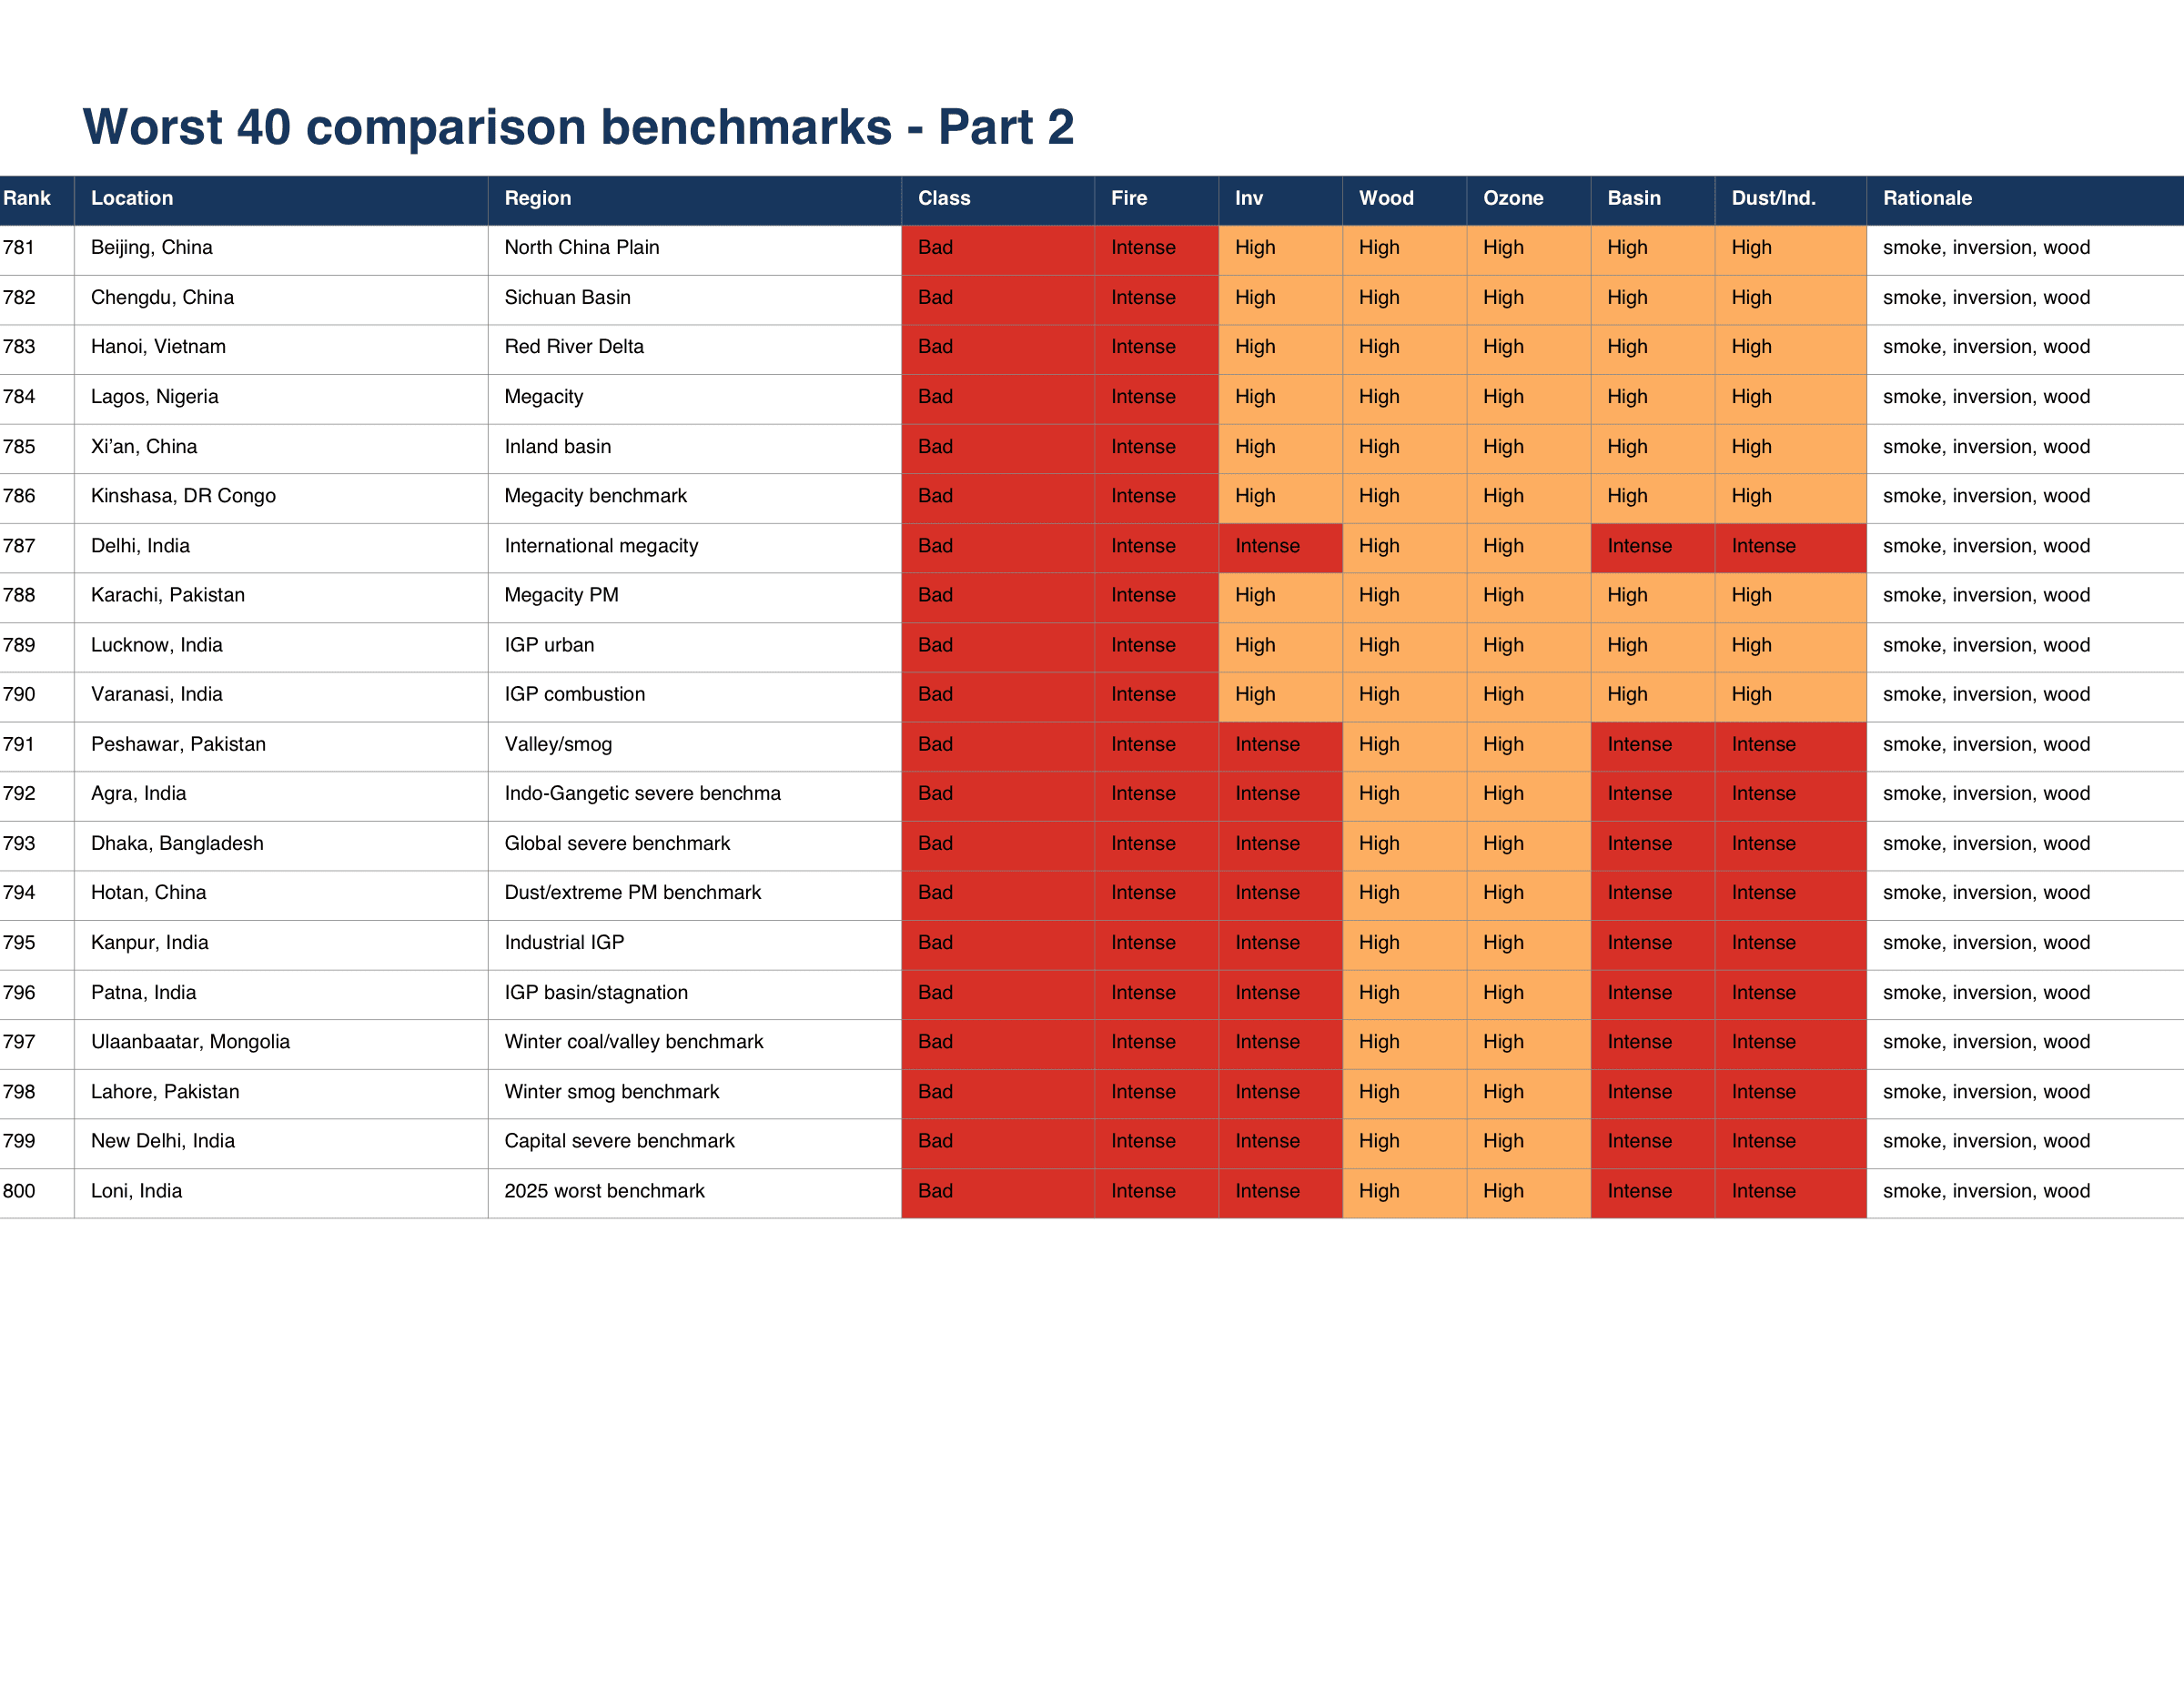
The atlas uses severe global benchmarks so readers can understand scale. Cities such as Loni, Delhi, Agra, Lahore, Hotan, Ulaanbaatar, Dhaka, and related high-PM environments show what the far end of the spectrum looks like.
IQAir's 2025 World Air Quality Report identified Loni, India, as the most polluted city in its dataset, with an annual average PM2.5 concentration of 112.5 ug/m3. The same report identified Nieuwoudtville, South Africa, as the cleanest city in its dataset, with an annual average PM2.5 concentration of 1.0 ug/m3.
Those two places become useful anchors.
They show the distance between air that is structurally protected and air that is structurally burdened.
The goal is not fear.
The goal is calibration.
Crescent City and the Coastal Exception
A strong coastal baseline can still need wildfire-season caution.
Crescent City, California receives special attention in the atlas because it is a Northern California coastal benchmark that people often ask about.
Its profile is strong in the ways coastal profiles usually are strong: low inversion risk, low ozone risk, low basin trapping risk, and low dust or industrial load.
But the atlas does not treat Crescent City as untouchable.
Major regional wildfire years can still push smoke into the North Coast. That means Crescent City can have a strong baseline ventilation profile while still carrying moderate wildfire-smoke risk.
This is exactly the kind of nuance air-quality conversations need.
A place can be structurally better than another place and still require seasonal caution.
The Practical Lesson: Do Not Confuse "Cleaner" With "Immune"
The atlas is a first screen, not a final answer.
The most useful way to read the atlas is not as a trophy list.
It is not a fantasy map.
It is not a promise that one town will protect every person.
It is a first screen.
A cleaner baseline gives you a better starting position. It does not remove the need for local investigation.
Before making a health-sensitive move, buying property, signing a lease, or choosing a long-term retreat location, the atlas should be followed by real local checks.
Review neighborhood-level sensor data.
Check seasonal wildfire smoke history.
Look at winter inversion patterns.
Ask about residential burn rules.
Study ozone alerts during heat events.
Look for nearby extraction, agriculture, ports, highways, and industrial sources.
Visit during the worst season, not only the prettiest one.
Inspect the building itself. Outdoor air matters, but infiltration matters too. A house with poor sealing, bad filtration, mold, combustion sources, or attached-garage contamination can turn a good regional profile into a bad personal exposure.
The atlas can tell you where to look.
It cannot replace the act of looking.
What the Atlas Reveals
Air quality is not only pollution. It is pollution plus place.
The strongest clean-air places tend to share ventilation, coolness, and distance from chronic combustion or dust loads.
The highest-risk places tend to layer multiple forces: smoke, heat, inversion, basin trapping, traffic, industry, agriculture, dust, and residential burning.
The most deceptive places are often in the middle: beautiful, livable, and conditionally risky.
This is where the atlas has value.
It turns air from an abstraction into a pattern.
It reminds us that pollution is not only what comes out of a pipe. It is also where that pollution goes after it is released. Does the land disperse it? Does the ocean flush it? Does the valley hold it? Does the heat transform it? Does the winter lid press it back down into lungs?
Air is local.
Air is seasonal.
Air is structural.
And once you learn how to read it, the map changes.
Live Pure Means Reading the Air Honestly
Clean air is not a lifestyle accessory. It is the first condition of a livable home.
To live purely is not to romanticize nature.
Nature includes wind, fire, dust, heat, and stagnation.
To live purely is to stop outsourcing perception.
It means asking what a place is doing to the body before the body has to scream.
It means seeing the invisible systems that shape daily exposure.
The Professional Air Quality Atlas gives readers a starting point. It does not make the decision for them. It gives them a clearer lens.
And in a world where air quality is becoming more unstable, that lens matters.
Because clean air is not a lifestyle accessory.
It is baseline medicine.
It is environmental justice.
It is the first condition of a livable home.
Sources and Use Limits
This article is based on the Professional Air Quality Atlas: 800-location visual environmental-risk matrix, Version 2 expanded global benchmark edition.
The atlas is a screening-scale tool. It should not be treated as medical, legal, or real-estate advice. It should be followed by neighborhood-level sensor checks, seasonal smoke review, indoor infiltration testing, local burn-rule research, and on-site inspection before making health-sensitive housing or relocation decisions.
External benchmark reference: IQAir 2025 World Air Quality Report press release, March 24, 2026.
NEVER MISS A THING!
Subscribe and get freshly baked articles. Join the community!
Join the newsletter to receive the latest updates in your inbox.


